
Graph Interpretations (Quadrants)
X‐axis is time in hours.
Y‐axis is ml of gas produced from the 400 mg sample.
Total represents the curve of the total amount of gas produced from a 400mg sample incubated in rumen fluid for 48 hours. In general, 60% of the total gas production asymptote is reached in the first 24‐hours so this is the most important portion of the gas production curves to focus attention.
Slow represents the amount of gas produced from the slow pool. Given the heterogeneity of its nature, the slow pool is comprised primarily of fiber (B3 Pool, hemicelluloses and cellulose) along with slowly degradable starch.
Fast represents the gas produced from fast pool consisting primarily of B1 (starch) and B2 (soluble fiber) pools; although it is possible for very rapidly digesting (B3) fiber to also contribute to the fast pool of gas. In TMR’s, fast pool gas amounts higher than about 40 ml of gas are indicative of excess acetate (which produces gas) and reduced levels of propionate (minimal gas production and more ATP) coming from the fast pool nutrients. TMR samples with over 40ml of gas from the fast pool generally appear to need more energy for microbial protein production, thus supplementation should be considered using propionate producing feeds (grains) as opposed to forages or non‐forage fiber sources (NFFS) like soy hulls or beet pulp. It should be noted that these pools are not homogeneous because there can be both slow and fast pools within each carbohydrate fraction (e.g. the slow pool may contain some slowly digested starch). This fact may present challenges for those looking for an analysis that reflects the fermentation of chemically identifiable and measurable feed fractions, however, it does approximate the nature of ruminal fermentation and provides a practical means to evaluate rations, predict the productive response and make sound nutrition decisions affecting productivity and profitability (Johnston and Tricarico, 2007).
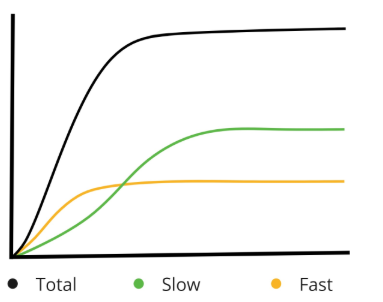
Quadrant 1
TMR - Q 1
CB1 Kd 18-20%/hr
CB3 Kd 5-6%/hr
Observations
Good manure consistency
High dry matter intake (DMI)
Excellent milk yields
Exceptional feed conversion
Actions to Consider
Watch for (prevent) sudden changes in feed delivery or consistency.
Ensure adequate peptide and degradable crude protein to feed rumen microbes.
CS - Q 1
Rapid fibre digestion.
Rapid starch digestion.
DMI will be good.
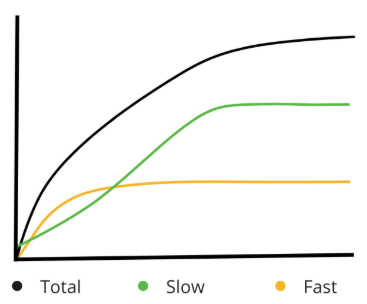
Quadrant 2
TMR - Q 2
Small pool of CB1 that disappears quickly
CB3 Kd: 5-6%/hr
Observations
Grain in manure
Low milk protein
Milk yield lower than expected
Rough hair coats
Poor reproduction
Actions to Consider
Increase supply of rumen-available starch and sugar (CB1 Kd of 20-22%/hr)
Grind grains finer
Ensure adequate supply of peptide and NPN protein
CS - Q 2
Fibre digestion is slow and not extensive.
Rapid starch digestion over a short period.
Potential Acidosis
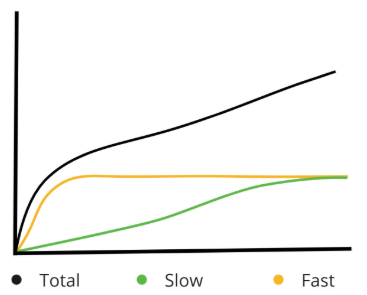
Quadrant 3
TMR - Q 3
CB1 Kd: >25%/hr
CB3 Kd: <5%/hr
Observations
High acidosis potential
Sore feet, reproductive problems, poor DMI
Ketosis in early lactation cows
Fiber in the manure - low rumen pH
Variability in body condition
Fat/Protein inversion in >10% of the herd
Actions to Consider
Increase NDFD by adding non-forage fiber sources
Slow CB1 Kd to <5%/hr
CS -Q 3
Good Fibre digestion over a long time period.
Slow Starch digestion.
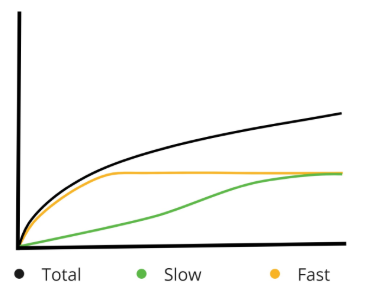
Quadrant 4
TMR - Q 4
CB1 Kd: <15%/hr
CB3 Kd: <5%/hr
Observations
Cows look “ok”
Poor milk production
Early peak / Poor peak milk
Average milk components
Stiff manure despite adequate dietary CP
Very expensive ration per CWT
Reproduction - delayed, but not too bad
Actions to Consider
Increasing rumen available starch and sugar
Grinding grains finer
Increase NDFD by adding more non-forage fibre (beet pulp, brewers, soyhulls, etc), and/or more digestible forages.